The Bitcoin price is approaching the $100,000 level again after propelling Bitcoin past the $100,000 mark.
Bitcoin Price Faces Resistance At $99,800
Prominent crypto analyst Ali Martinez hasBitcoin price is facing extreme resistance between the $97,500 and $99,800 price levels as it tries to breach $100,000 again.
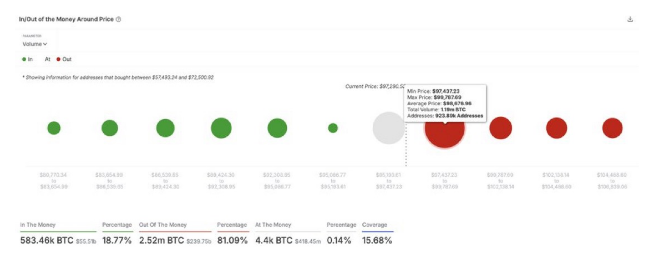
Martinez noted that around this price range, approximately 923,890 wallet addresses had purchased over 1.19 million BTC. This price zone acts as an important resistance level because many Bitcoin holders may look to sell and break even, potentially exerting selling pressure.
In the IOMAP chart shared by Martinez, the green dots that signal ‘In the Money’ represent price levels below the current Bitcoin price, where wallet holders are in profit because they bought BTC at a lower value. On the other hand, the red dots that represent ‘Out of the Money’ show price levels of Bitcoin’s present value, where wallet holders are at a loss because they bought BTC at a higher price.
Lastly, the white dot indicates ‘At the Money’ and represents the current price of Bitcoin at an average of $98,676, where some crypto wallets see neither profit nor loss.
Below Bitcoin’s current price, the chart shows strong buying zones, which could provide strong support if the pioneer cryptocurrency experiences a bullish rally for Bitcoin, potentially leading it to a new all-time high.
Currently, the Bitcoin price is trading at $98,652, steadily rising to return to previous highs above $100,000. To a new all-time high, Bitcoin will have to surge by over 7%, surpassing its present ATH above $104,000.
Bitcoin’s Biggest Gains To Come After Christmas
A popular crypto analyst identified as the ‘Crypto Rover’ has significant gains right after Christmas during the halving years.
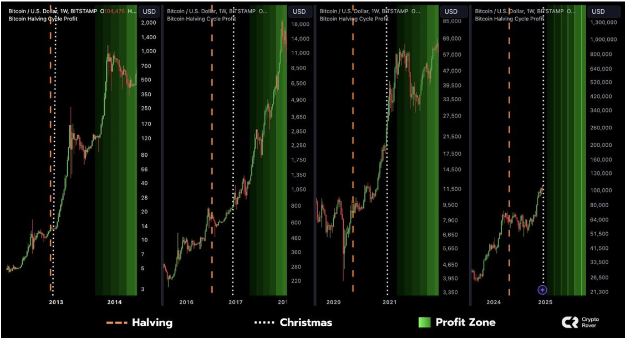
The analyst shared a price chart showing Bitcoin’s market performance during each halving cycle. In the 2012 halving year, Bitcoin started a significant price rally, which extended into the following year. The same bullish trend occurred in the next halving years in 2016 and 2020, with Bitcoin hitting exponential price highs.
Based on this historical trend, Crypto Rover projects that Bitcoin could witness a similar bullish surge before the end of 2024, with the rally potentially continuing into 2025.
Featured image from Bloomberg Images, chart from TradingView